Visualization & Dashboards
Whether it's Reports, Scorecards or Dashboards, We can help.
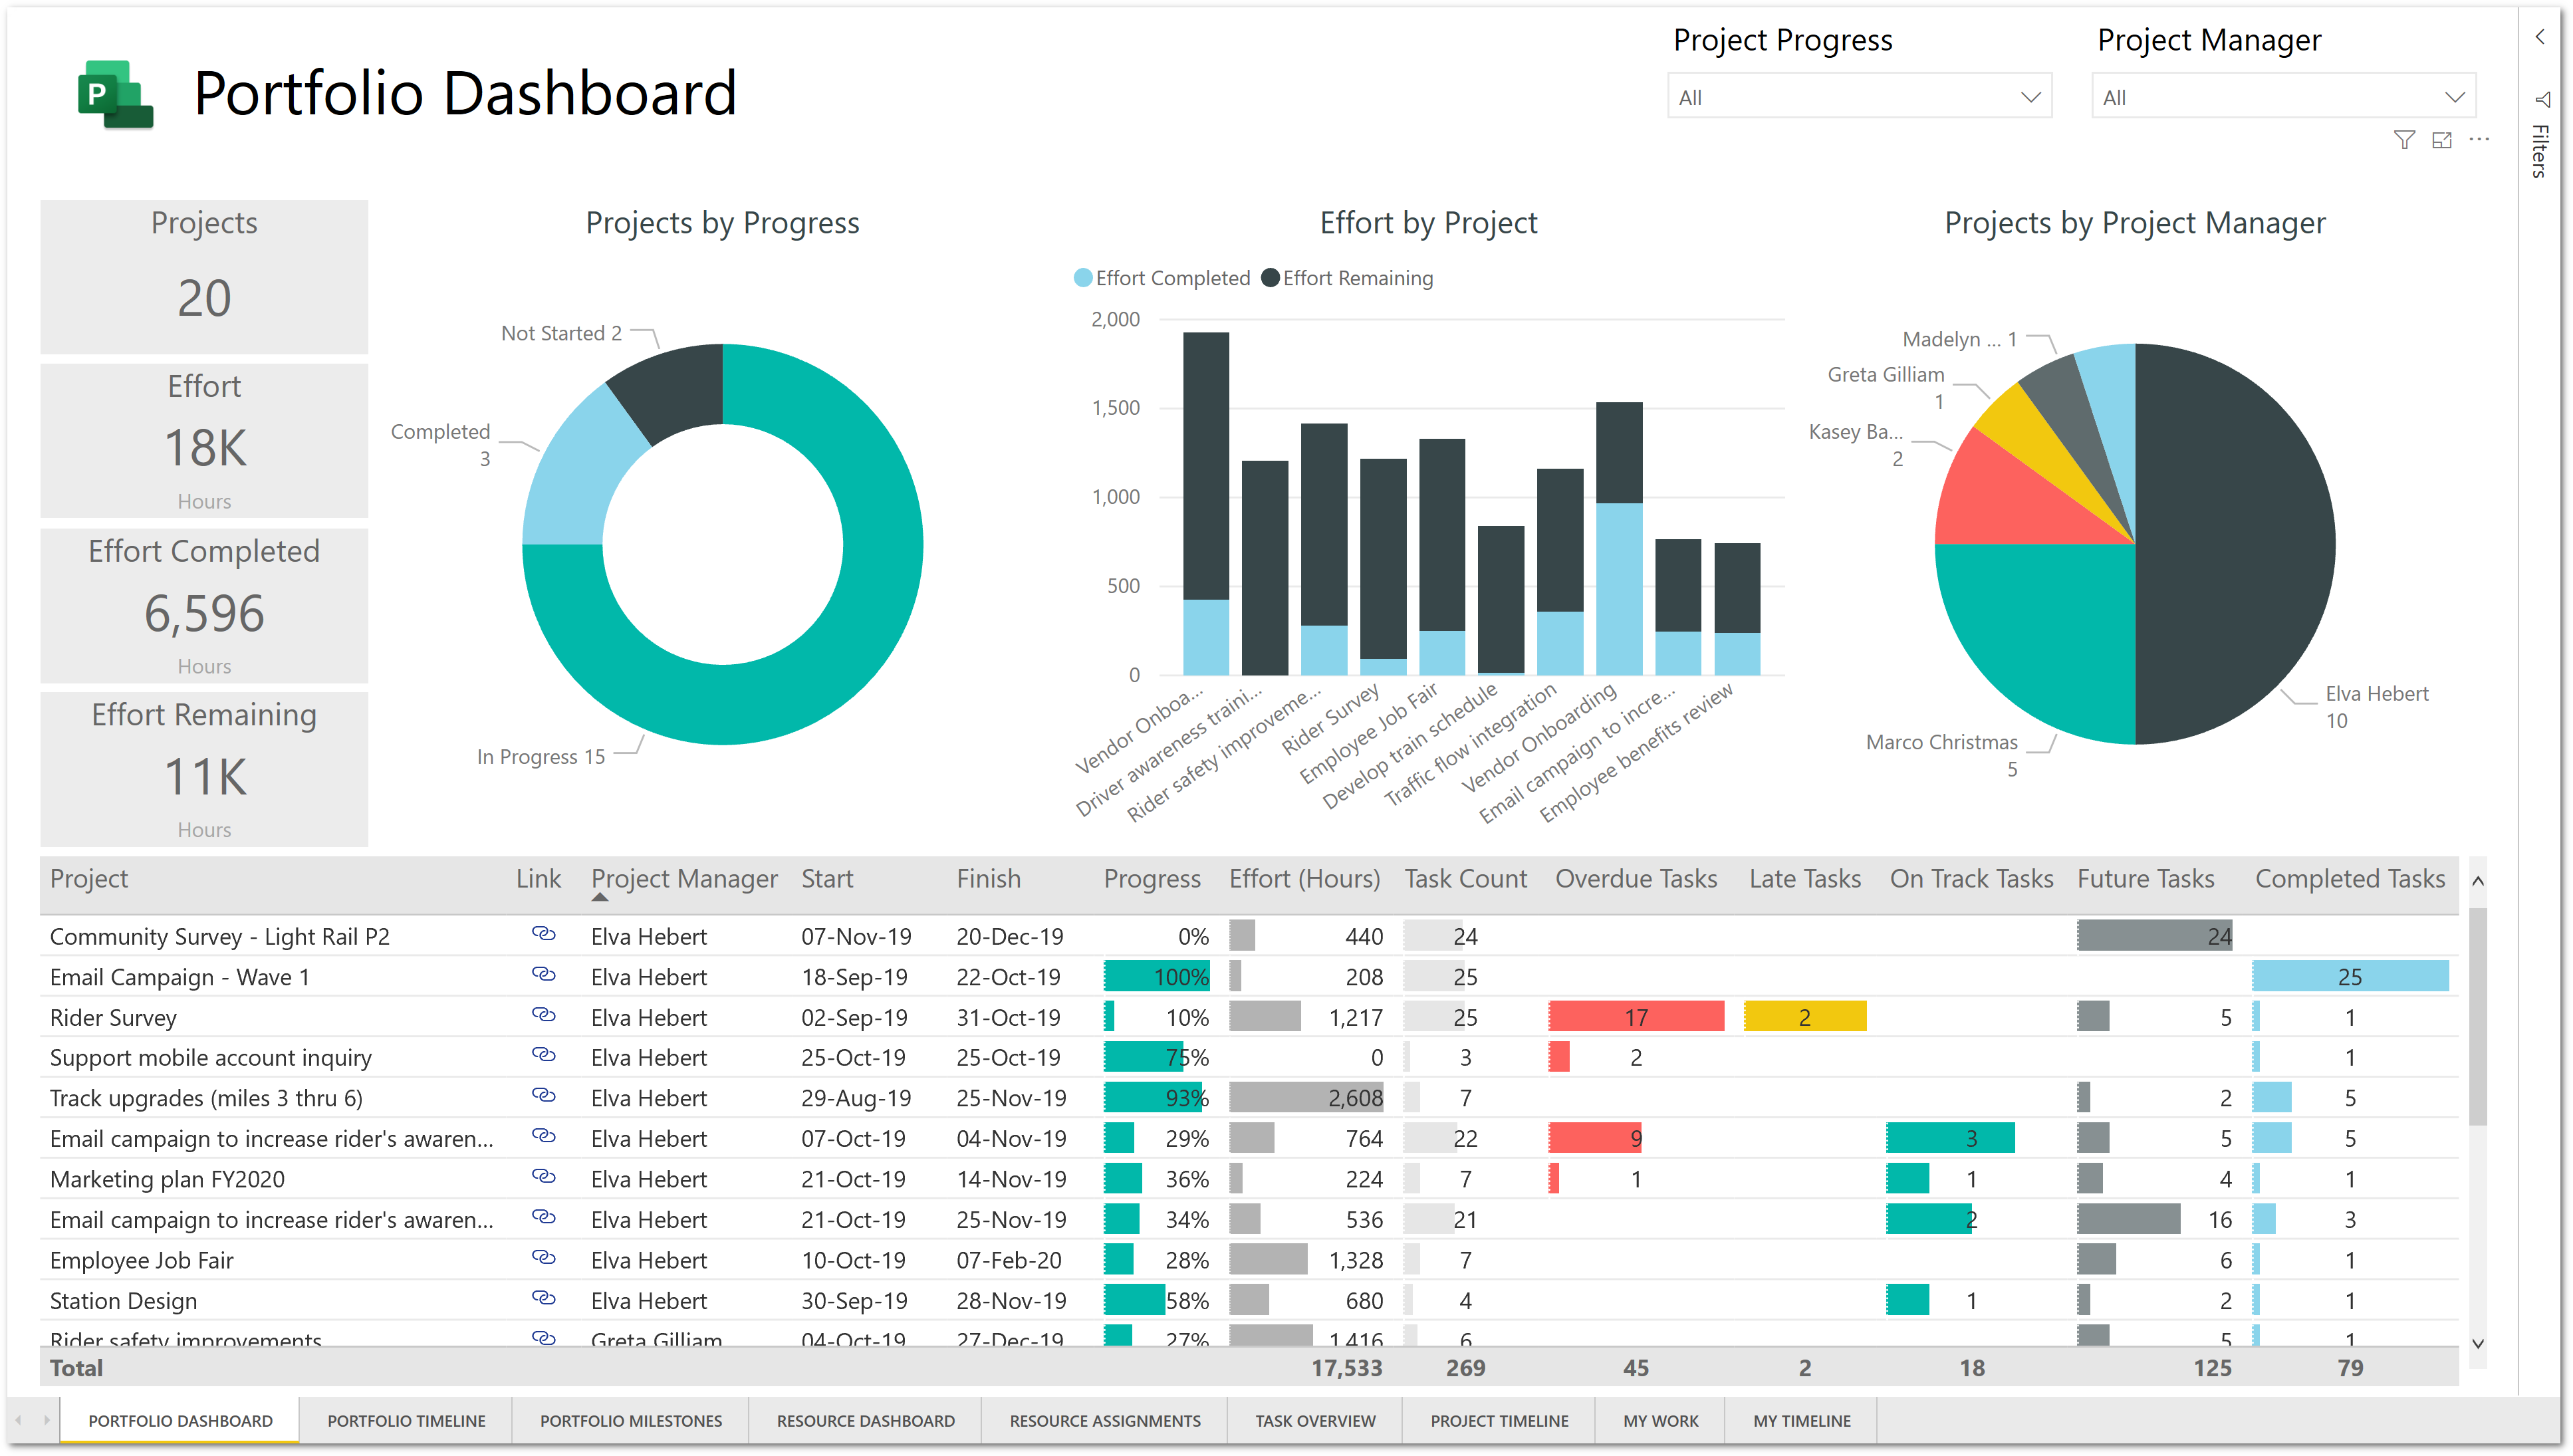
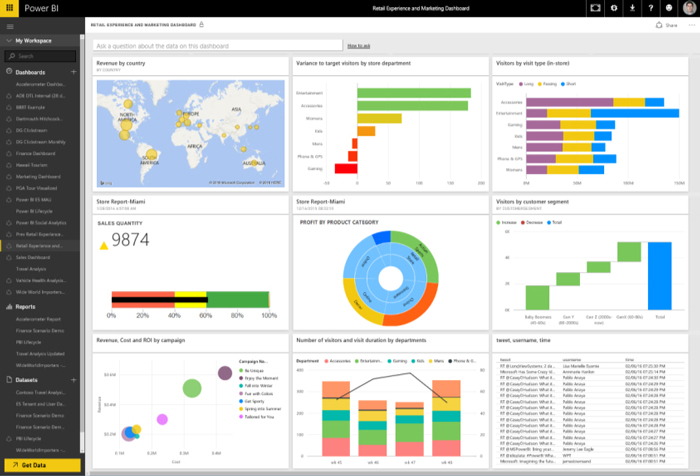
Power BI makes it easy to connect your reports and dashboards to disparate data sources. Power BI can natively connect to databases and services on-premises or in the cloud such as SQL Server, Oracle, SharePoint, Dynamics CRM, Dynamics 365, Salesforce, Excel workbooks, and many other third-party systems. There is no need for a developer to configure connection strings or complicated ETL (Extract, Transform, and Load) processes. Power BI is also an integral component of Microsoft’s Azure IoT platform.
Reports, Scorecards and Dashboards
Regardless of where you store your data, Black Rock Technologies will help you implement solutions that use your data to provide value to your organization. Black Rock Technologies provides consulting services that include:
- Defining goals, KPIs, and measurements
- Designing and implementing a comprehensive data strategy
- Evaluating and integrating existing systems
- Assessing the role of artificial intelligence and machine learning in your analytics strategy
- Building reports and dashboards using BI tools, like Microsoft Power BI
- Providing hands-on training


Business Analytics with Power BI
Because of limited resources, many small construction companies lack a strong data strategy. This means they don’t always have access to valuable project data and insights.
Over time, not having a data strategy hinders a firm’s ability to be competitive. When you don’t have the right information, you’ll find it difficult to make critical decisions quickly, ultimately hurting your performance.
Here’s How We Do It
At Black Rock Technologies, we use a three-step approach that integrates Power BI so that you can achieve cross-organizational benefits:
Business Analytics Strategy
Black Rock Technologies works with you to analyze your business strategy and growth plans. Based on these goals, we map out a business analytics blueprint designed to meet your business objectives.
Business Analytics Technical Architecture
Based on the blueprint, we define, develop, and implement technical requirements, architecture, and ETL pipelines using Microsoft Power BI and Azure tools.
Power BI Dashboard and Report Development and Prioritization
We work with your team to define, prioritize, develop, test, and implement required dashboards, analytics, and reports to drive business insights.
Our Business Transformation Approach
We take your success seriously. That’s why we have developed an outcome-based approach to ensure the best possible results. Our value-added business transformation methodology harnesses the power of your technology to provide immediate value and ensure go-live success.
Let us show you how to fast-track your digital transformation for better business outcomes.

